
Ripple has launched rLUSD, a U.S. dollar-pegged stablecoin, to accelerate adoption of the XRP Ledger and address volatility in the crypto space. The move targets both retail and enterprise markets, aiming to expand Ripple’s ecosystem amid regulatory shifts and rising institutional interest in stablecoin use.
Ripple Targets Stable Payments With rLUSD
Ripple introduced rLUSD to offer a stable and predictable payment option across its XRP Ledger. The dollar-pegged asset is designed to reduce crypto volatility, enabling safer transactions for consumers and scalable solutions for businesses.

Retail users can use rLUSD for daily payments without worrying about price fluctuations. At the same time, enterprise clients are expected to adopt the stablecoin for large-scale uses such as payroll processing, supply chain operations, and international transactions.
The rollout comes as Ripple strengthens its stablecoin strategy in response to global regulatory advances, including Dubai’s recent approval of RLUSD for enterprise use.
To ensure trust and compliance, Ripple partnered with BNY Mellon for custody of rLUSD’s reserves. This adds institutional credibility and transparency, setting rLUSD apart from rivals like USDC and Tether.
The timing aligns with ongoing developments in U.S. policy. The recently introduced GENIUS Act aims to provide legal clarity for stablecoins, which could further support rLUSD’s adoption among regulated institutions.
Institutional Momentum and Regulatory Support
Global institutions are already exploring integration. Citigroup is reportedly evaluating stablecoin applications, and ProShares recently rolled out Ultra XRP ETFs, signaling growing investor demand for XRP-linked products.
Ripple is also enhancing its cross-border payment infrastructure, using rLUSD to lower costs and speed up settlement times across the XRP Ledger. These combined efforts support Ripple’s broader goal of linking traditional finance to blockchain-based ecosystems.
Adoption Grows Despite Market Pressures
Ripple’s new stablecoin arrives as XRP recorded an 80% price surge in July 2025, which increased attention on the network’s underlying technology. While price was not a factor in the rLUSD announcement, the market movement coincides with the company’s renewed push into digital finance infrastructure.
Still, competition remains a challenge. rLUSD will need to carve out market share against established players like USDC, and it faces close scrutiny as regulators worldwide set new compliance standards.
For now, Ripple’s rLUSD initiative signals a shift toward enterprise-grade blockchain adoption backed by regulatory alignment and custody transparency.
XRP Forms Bearish Rising Wedge, Hints at 19% Decline Toward $2.64
On July 26, 2025, XRP/ USDT formed a bearish rising wedge pattern on the 1-hour chart against the U.S. Dollar, based on data from Bitstamp. The pattern emerged after XRP’s brief recovery attempt following a sharp drop. A bearish rising wedge appears when the price moves within two converging upward-sloping trendlines, typically signaling weakening momentum and a possible breakdown.
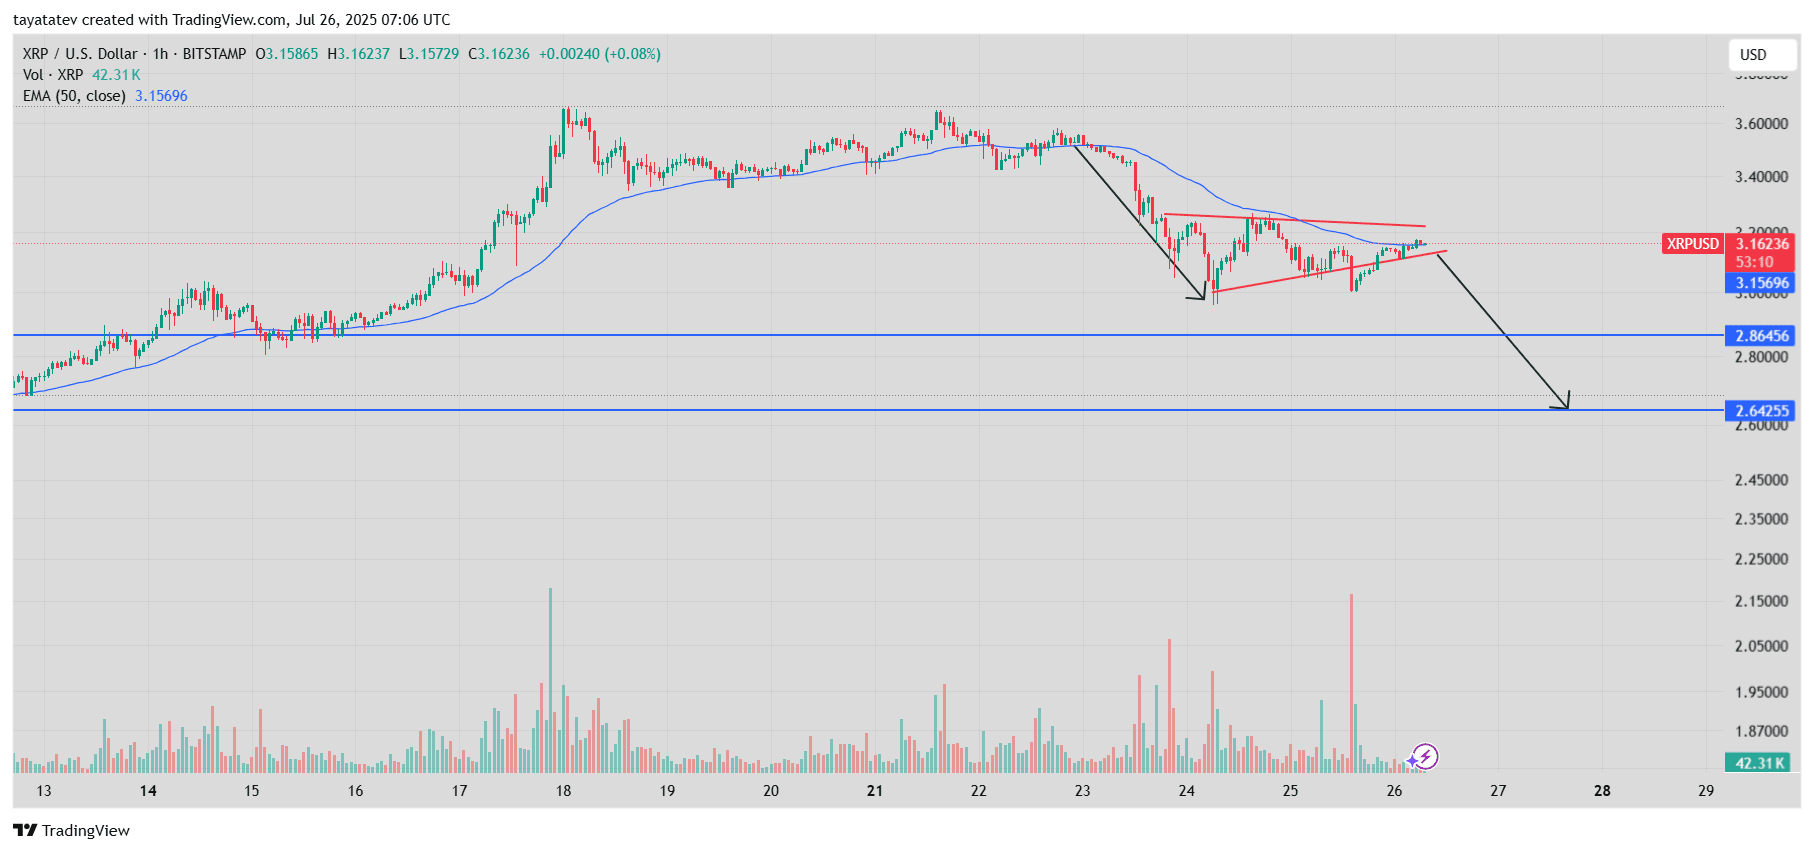
In this case, XRP trades near $3.16 while staying below the 50-period exponential moving average (EMA), which currently hovers around $3.15. The consolidation within the wedge followed a strong downward move and reflects a slowdown in bullish pressure. This setup usually warns that buyers are losing control, increasing the probability of a downward breakout.
The chart also shows a breakdown projection with a downward arrow pointing to $2.64, which represents a potential 19% drop from the current price level. Two support levels are marked—first around $2.86, then further down near $2.64, which aligns with the projected fall. If XRP breaks below the wedge with strong volume, it could confirm the bearish outlook and trigger a move toward these lower targets.
The price currently struggles to stay above the EMA, and the wedge is narrowing. Volume remains low, which may indicate consolidation before a larger move. As the pattern matures and the price nears the lower wedge boundary, a breakdown would validate the structure and likely result in a sharp decline. Traders now watch for confirmation of this wedge break, as XRP risks a continued correction in the short term.
XRP RSI Shows Neutral Momentum With Rising Pressure
This Relative Strength Index (RSI) chart for XRP, published on July 26, 2025, uses a 14-period setting on the 1-hour timeframe. The RSI line is currently at 56.49, while its moving average sits at 52.73. These levels suggest that XRP is trending upward from recent weakness but has not yet entered overbought conditions.
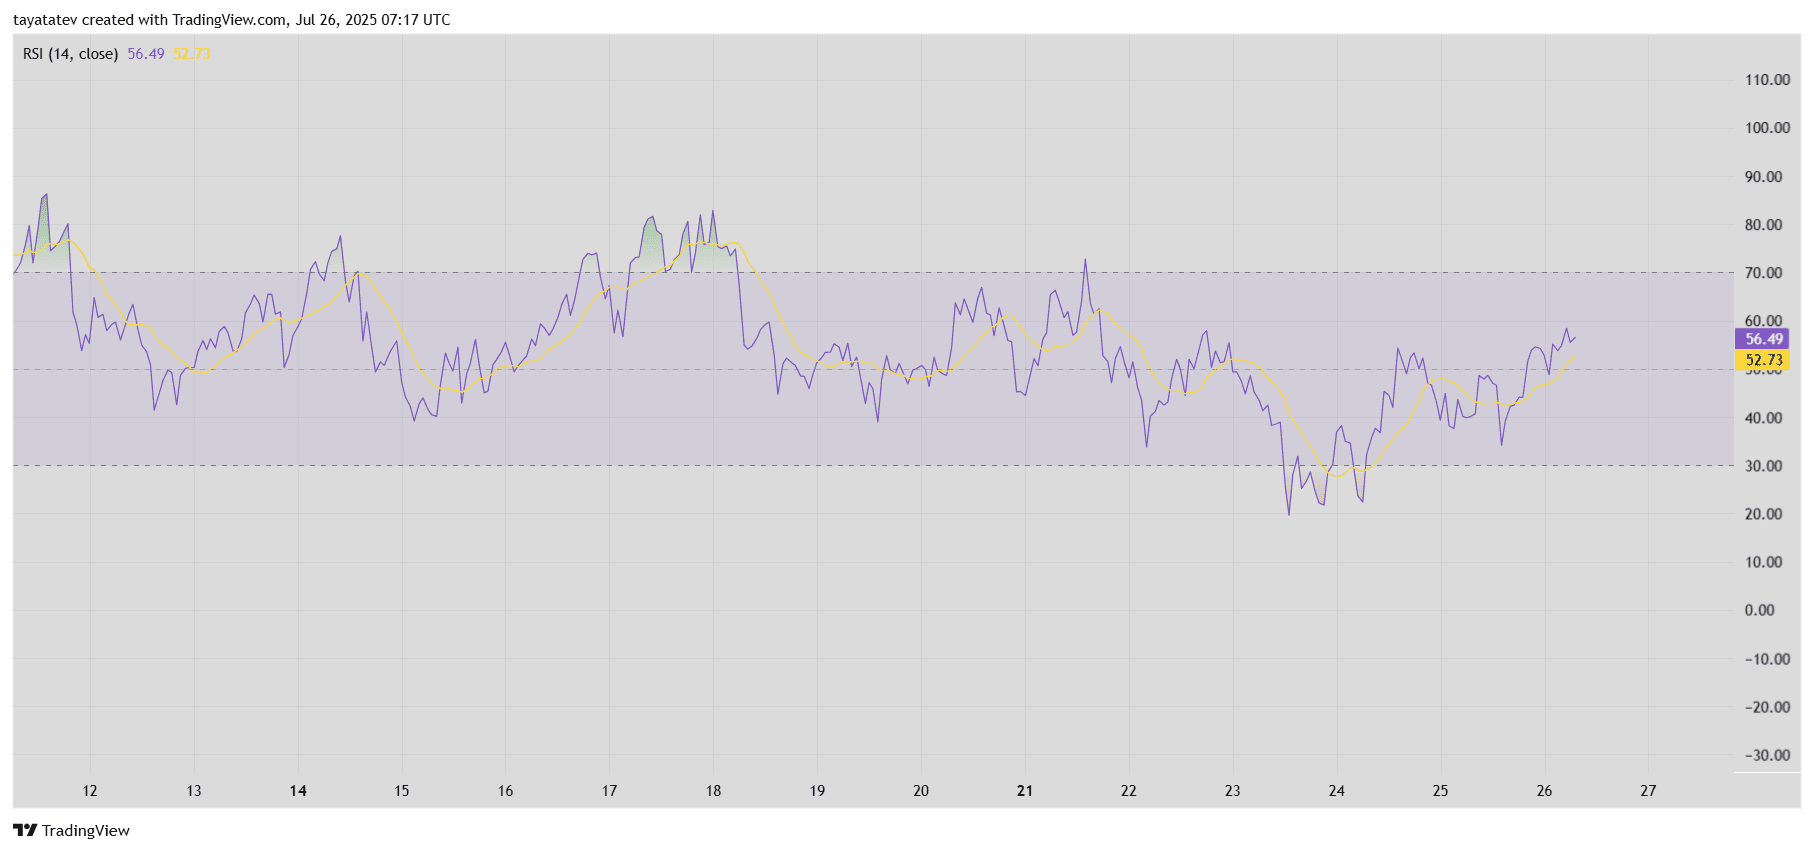
The RSI has steadily climbed after dipping below 30 on July 24, which marked a brief oversold phase. Since then, momentum has shifted slightly bullish, with the RSI pushing toward the upper half of the neutral 30–70 zone. This climb indicates recovering demand, although it hasn’t reached the overbought zone (above 70) where a price correction would typically become more likely.
At the same time, the RSI remains below the key 70 threshold, suggesting buyers have gained some control, but not enough to confirm a strong trend reversal. The indicator points to a cautious uptrend in strength, aligning with the price consolidation seen in the rising wedge from the price chart.
However, if XRP fails to push the RSI higher and it turns back down from the 60s range, it may reinforce the bearish wedge breakdown pattern discussed earlier. This RSI structure, hovering between 50 and 60, reflects indecision but leans slightly bullish as long as it holds above the midpoint.
In short, RSI momentum suggests neutral-to-mild bullish pressure, but not enough to dismiss the bearish setup visible in price action.
XRP MACD Signals Early Bullish Crossover on July 26, 2025
The Moving Average Convergence Divergence (MACD) chart for XRP, dated July 26, 2025, shows a developing bullish crossover on the 1-hour timeframe. The MACD line (in blue) currently stands at 0.00957, slightly above the signal line (orange) at 0.00069. Both lines are moving upward, and the histogram bars have turned green, indicating rising positive momentum.
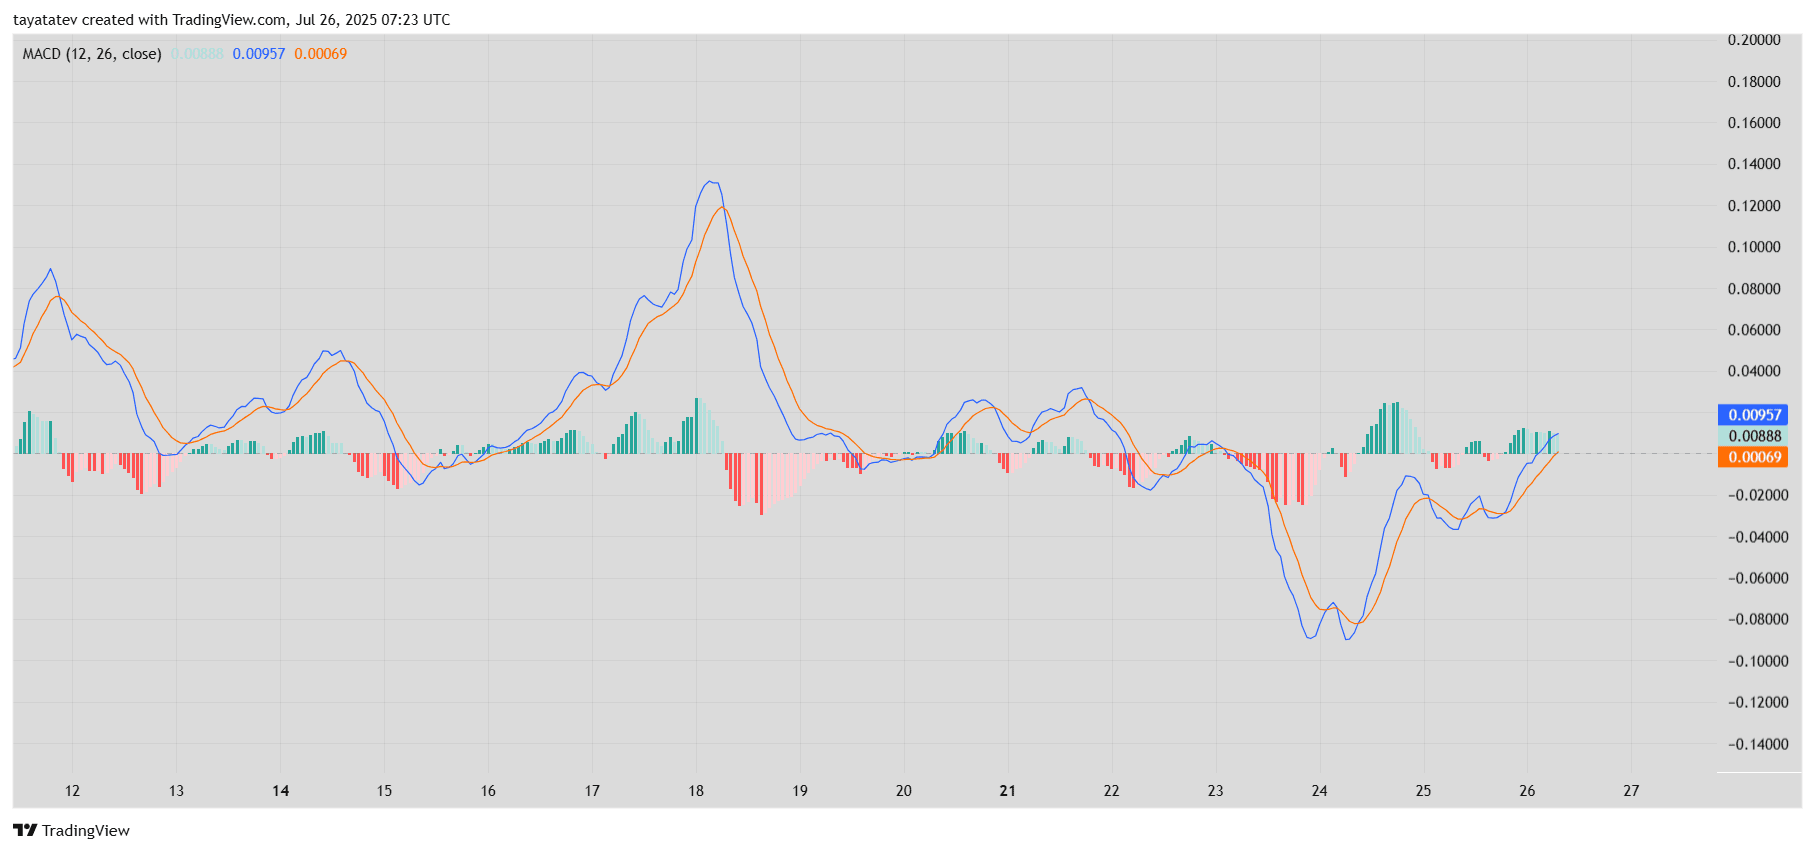
A bullish MACD crossover happens when the MACD line crosses above the signal line, signaling a shift in momentum from bearish to bullish. In this case, the crossover confirms a short-term trend reversal following the sharp decline seen earlier on July 24. Since then, XRP has been building momentum, and the increasing histogram bars reflect stronger buying activity.
This setup marks the early phase of a potential recovery. However, the overall trend remains cautious because the MACD values are still close to the zero line. While momentum has improved, XRP needs continued upward movement to sustain any rally. If the MACD continues to widen above the signal line, it may support a bullish breakout attempt—unless the rising wedge breakdown on the price chart plays out first.
In short, the MACD suggests that bullish momentum is returning, but the move is still developing. XRP traders may view this as a short-term strength signal, especially if confirmed by price holding above key support.


 Price Prediction 2025 2026 2027")


Leave a Reply